Web制作、Web開発の歩き方

初心者のためのDjango入門

■第18話:Pandasのデータ操作とデータ変換

(最終更新日:2023.06.19)

Djangoフレームワークのイメージ
この記事は5分で読めます!
(絵が小さい場合はスマホを横に)

「Pandasを用いてデータを自在に操ろう!」

Pandasは表計算ソフトと同じ形式でデータを保持できるため、データ操作も得意である。 今回は、ソートやマージ、フィルタリング、グループ化といった良くある操作に加えて、 欠損データに対する処理についても説明していく。


1.データの選択とフィルタリング

本項では、PandasのDataFrameから特定のデータを選択したり、 特定の条件に基づいてデータをフィルタリングする方法を説明する。 DataFrameから特定の列を選択するには、選択したい列の名前を指定する。 下記では、Name列を選択し抽出している。
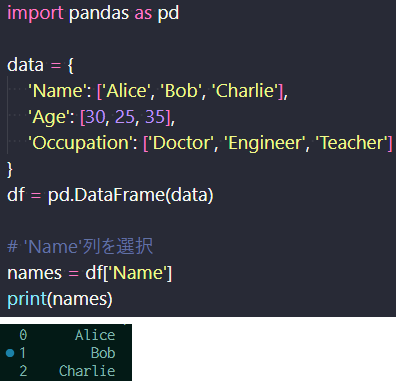
列の選択

指定した列の選択

複数行を選択するには「df['Name', 'Age']」のように、カンマで区切って2つ指定することで簡単に実現できる。 また、特定の行番目を選択する、列番目を選択するには以下のように書く。
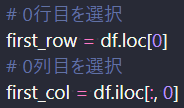
指定した順番の列と行の選択方法

指定した順番の列と行の選択方法

最後にフィルタリングの方法を説明する。 比較演算子を用いて、特定の条件を満たす行を選択するには以下のように記述する。 下記では、「30歳以上の人」「30歳以上で医者の人」をフィルタリングしている。 複数条件は&&等の論理演算子を使って記述することができる。
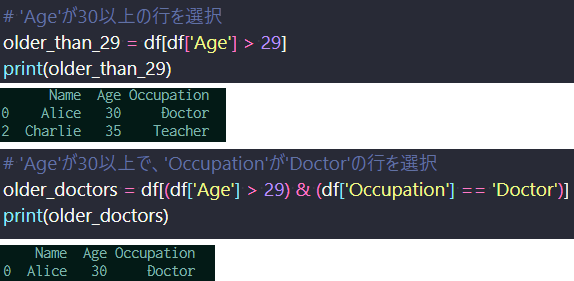
Pandasのフィルタリング

Pandasのフィルタリング

2.データの操作と変換

本項では、PandasのDataFrameを用いて、データのソート、結合、マージ、グループ化について説明する。 ソートは、df.sort_values(ソートしたい項目)とするだけで、その項目順に並べ替えられる。 下記はAge順に並べた例である。
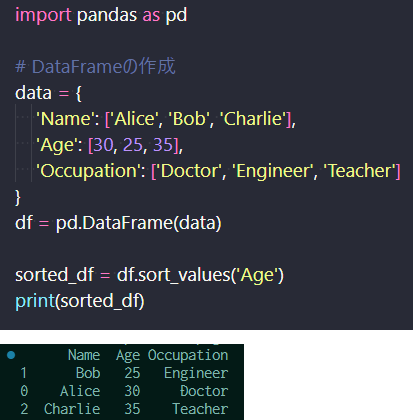
ソートの作成

ソートの作成(上)、出力結果(下)

また、ascending=Falseと指定することで、降順(年齢の高い順)に変えることもできる。
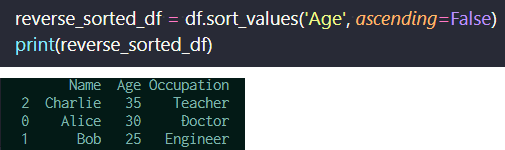
ソートの降順

ソートの降順(上)、出力結果(下)

2つのDataFrameを結合する場合は、concatを用いる。先ほどのdfと新たに作成したdf2を結合して、 新たにMikeの情報を追加している。

DataFrameの結合

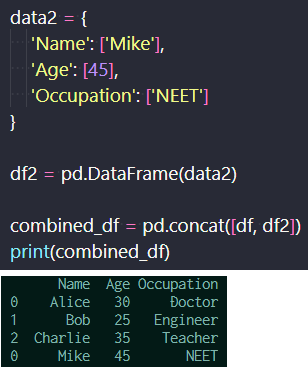
DataFrameの結合(上)、出力結果(下)

 また、新たな項目追加するにはmergeを用いる。マージは、ただ追加するだけではなく、重複している項目を省く。 下記では、新たな項目として、性別を追加している。ここではNameがユニークなので、Nameに基づいてマージしている。 (ただし、同じ名前も有りうるため、通常はid番号などを用いる。)

マージ

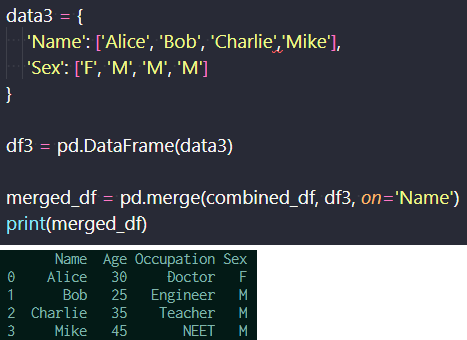
特定の列に基づくマージ(上)、出力結果(下)

目的通りのデータフレームが作成できたら、その後はデータ分析をしたいはずだ。 例えば、平均値、合計値、最大値、最小値などを算出したい。そのとき用いるのが、groupby関数になる。 以下のように用いることで、職業ごと(同一項目ごと)の平均値を簡単に算出することができる。

平均

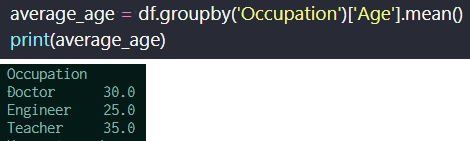
データフレームの平均値の算出(上)と結果(下)

3.欠損データの処理

Pandasを使用して欠損データ(NaNやNoneなど)を検出し、削除または補完する方法を説明する。 DataFrame内の欠損データを検出するには、isnaまたはisnull関数を使用します。 下記では、any().any()が無くても、全てのデータフレームに対して欠損値確認を行ってくれるが、全データに対して表形式でTrue, Falseを返すので見にくい。 存在するかどうかを見るには、any().any()を始めに用いることで、まず欠損が存在するのかを確認する。下記の場合は2つ欠損値があるのでTrueが返る。

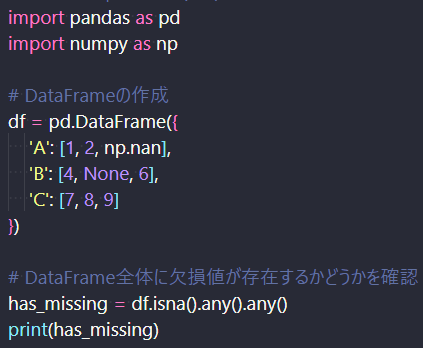
欠損値があることを確認したら、そのデータに対して削除、補間、いずれかで対処する必要がある。 DeepLearningを始め、機械学習用のデータ前処理には必要なことである。
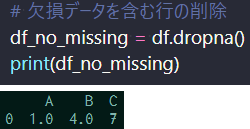
データに余裕がある時は、削除を行う。 欠損値データ行を削除するには、dropna関数を使用する。下記の通りである。 欠損値のある行が削除され、全て揃ってるデータ行だけになる。

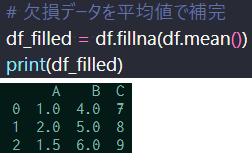
データに余裕がない時は平均値などで補間して用いる。 欠損値データ行を削除するには、fillna関数を使用する。下記の通りである。 補間値は平均に限らず、そこで最もらしい値を使う。

4.まとめ

今回、Pandasのデータのソート、結合、マージ、グループ化、欠損データの処理を行った。 どれも基本的で重要な操作だが、欠損データの処理はやや実践的だろう。 機械学習用のデータで、データが欠損していることはしばしばある。 どのような値を用いるか妥当性を考えた上で、値を補間していこう。


▼参考図書、サイト

Pandas loc と ilocの違いとは?  AI Academy Media
Pandas の groupby の使い方  Qiita
pandasで欠損値NaNを置換(穴埋め)するfillna  note.nkmk.me


Introduction to Django for Beginners ■Episode 18: Data Manipulation and Transformation with Pandas (Last updated: 2023.06.19) Image of Django Framework This article can be read in 5 minutes! (Rotate your phone horizontally if the image appears too small) "Let's manipulate data freely with Pandas!" Since Pandas maintains data in a format similar to spreadsheet software, it's excellent for data manipulation. In this article, we'll explain common operations like sorting, merging, filtering, and grouping, as well as how to handle missing data. [Table of Contents] Data Selection and Filtering Data Manipulation and Transformation Handling Missing Data Summary 1. Data Selection and Filtering This section explains how to select specific data from a Pandas DataFrame and how to filter data based on specific conditions. To select a specific column, specify the column name. The example below extracts the "Name" column. Select column Selecting a specified column To select multiple columns, use a comma to separate column names like `df['Name', 'Age']`. To select specific rows or columns by position, use the appropriate index. Selecting rows and columns Selecting specific rows and columns Finally, to filter rows based on conditions, use comparison operators. Below, rows of people aged 30 or older and those aged 30 or older who are doctors are filtered. Use logical operators like `&&` for multiple conditions. Filtering with Pandas Filtering with Pandas 2. Data Manipulation and Transformation This section covers sorting, concatenating, merging, and grouping data using a Pandas DataFrame. Sorting is as simple as `df.sort_values(column_name)`. The example below sorts data by the "Age" column. Sorting data Sorting (top), Output (bottom) You can sort in descending order by setting `ascending=False`. Descending sort Descending sort (top), Output (bottom) To concatenate two DataFrames, use `concat`. In the example, a new DataFrame `df2` is added to `df` to include information about Mike. Concatenating DataFrames Concatenation (top), Output (bottom) To add new columns based on keys, use `merge`. Unlike concat, merge eliminates duplicates. In the example, a "Gender" column is added by merging on the "Name" field. (Note: In real-world scenarios, use unique IDs instead of names.) Merging Merge based on a specific column (top), Output (bottom) Once the desired DataFrame is created, the next step is analysis— calculating averages, totals, max/min values, etc. Use `groupby` for this. Below, averages are calculated per occupation. Mean calculation Calculating mean values (top), Results (bottom) 3. Handling Missing Data This section explains how to detect, delete, or fill in missing data (e.g., NaN, None) in Pandas. Use `isna()` or `isnull()` to detect missing data. The result shows True/False for each cell, which can be difficult to read. To check if any missing values exist, use `any().any()`—if missing values are present, it returns True. Missing data detection If missing values exist, they must be either removed or filled in. This is a crucial preprocessing step for machine learning. If you have sufficient data, delete the rows with missing values using `dropna()`. Delete missing data If you don't have enough data, fill in missing values using `fillna()` with averages or other plausible values. Fill missing data 4. Summary In this article, we covered sorting, concatenation, merging, grouping, and handling missing data in Pandas. These are all basic yet essential operations. Handling missing data is especially practical—data often contains gaps in machine learning. Be mindful of the validity of the values used for imputation. ▼References   The Difference Between loc and iloc in Pandas – AI Academy Media   How to Use Pandas groupby – Qiita   Replacing Missing Values with fillna – note.nkmk.me